Measures and Compares Image Quality between a Reference and one or more Processed images.
The quality is quantified using 8 popular image quality indexes.
Contents:
Download | Screenshots | Program Description | Usage | Notes | Test Data | Source Code | How to cite | Credits
This application has been developed in Matlab. To run it on your computer, first you need to install the MCR (Matlab Compiler Runtime), which is FREE. It is important that you install the correct version. From the link below, download the version R2012b (8.0), for your platform.
After installing MCR to your computer, you can download and run ImAnalysis.
Download the appropriate standalone version for your platform:
Windows ![]()
Download ImAnalysis – Windows – 64bit.zip (recommended for 64 bit systems) [version 1.55]
Download ImAnalysis – Windows – 32bit.zip [version 1.55]
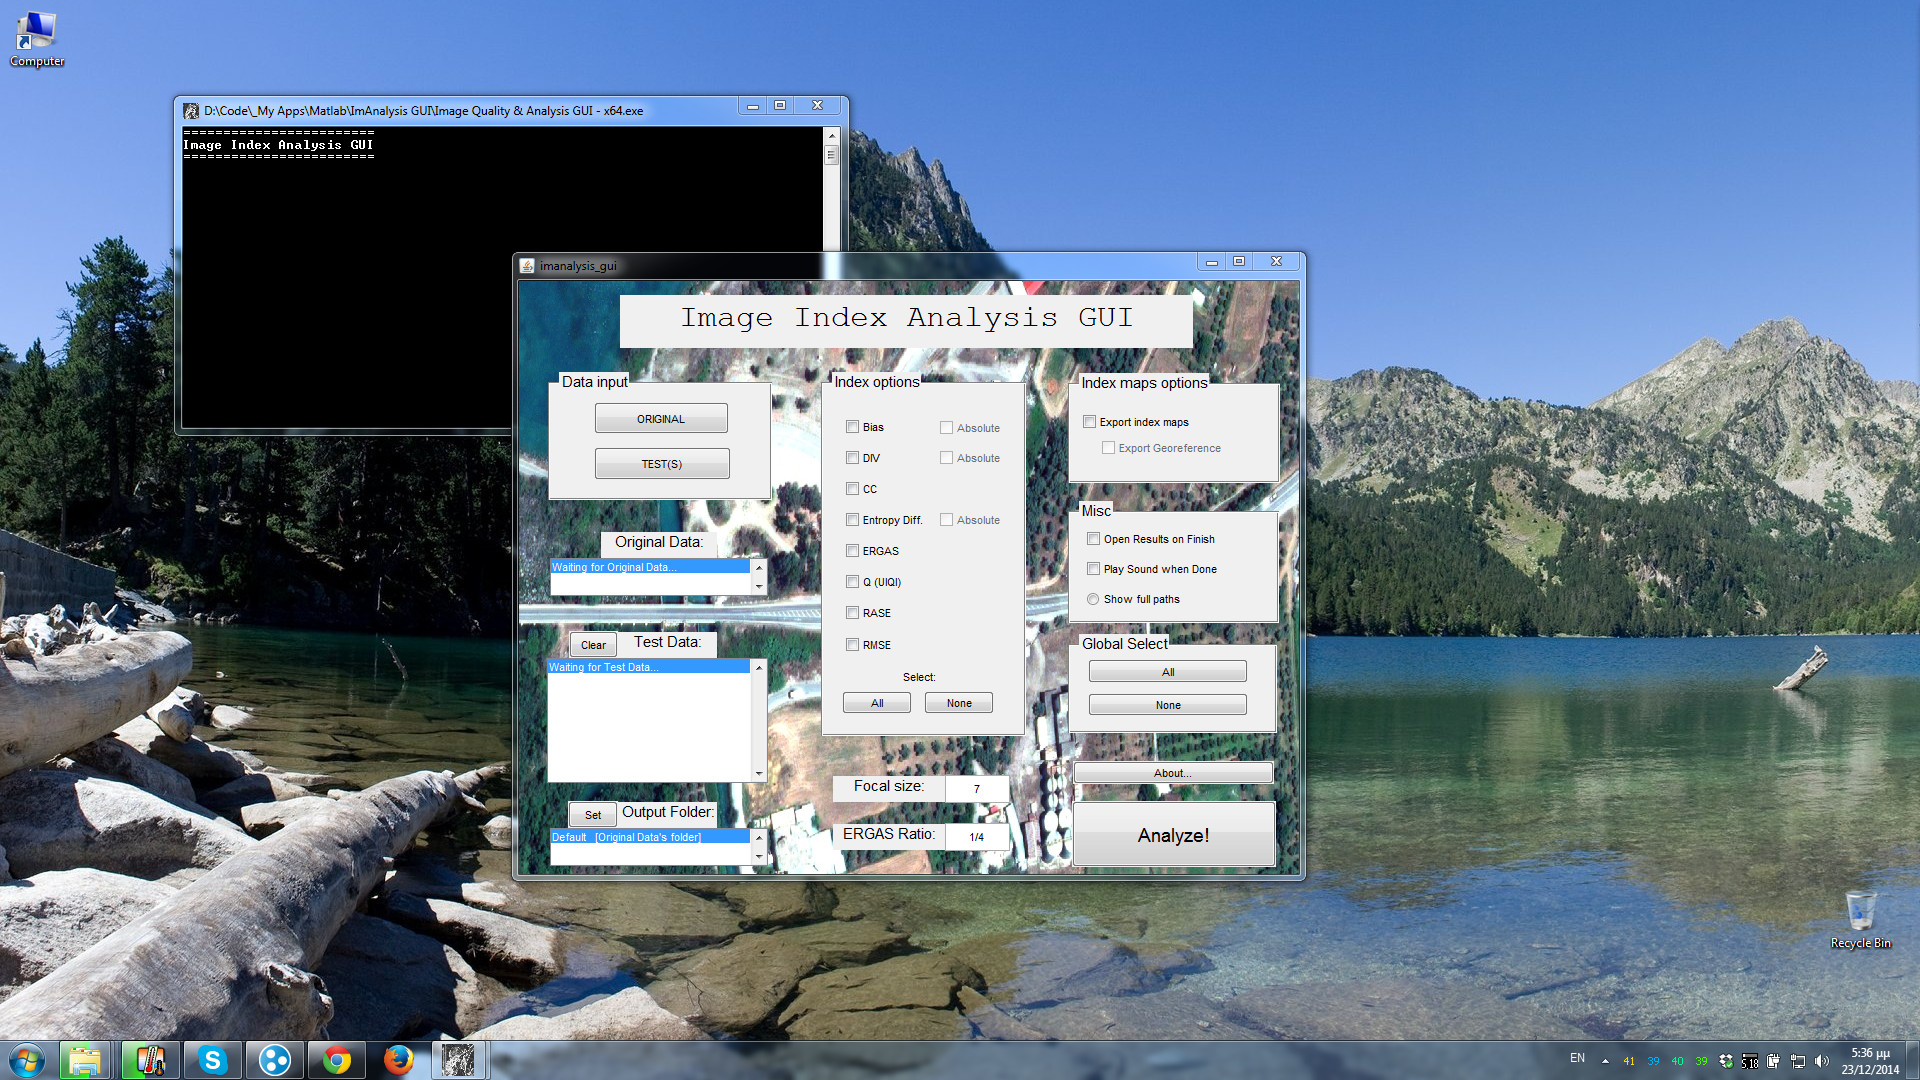
Figure 1: Running ImAnalysis on a Windows 7, 64-bit machine.
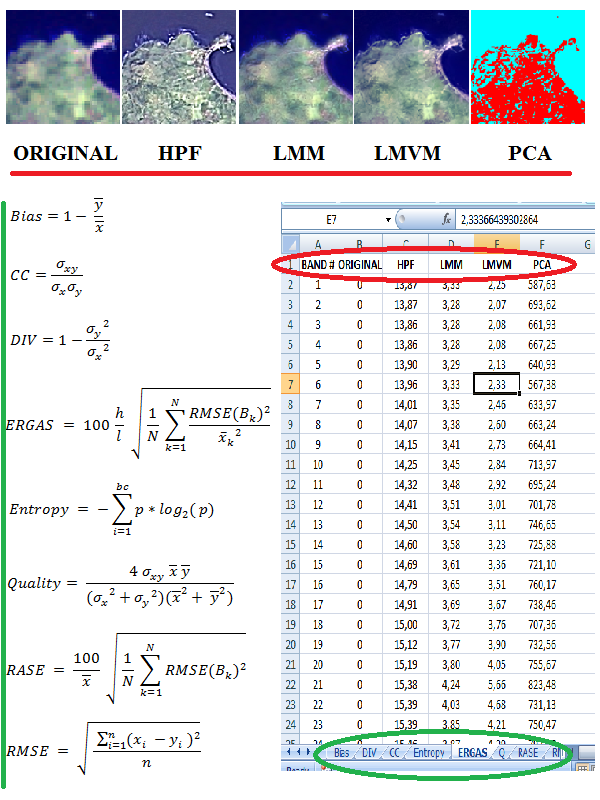
Figure 2: A scheme of ImAnalysis program. First, we input to the program a reference (original) and 4 test (processed) images. Then, the program performs the calculation of the indexes we desire (x = original image, y = test image, sigma (σ) = standard deviation). When the calculations have finished, the program writes the index analysis results in a new file (most likely a .xls file).
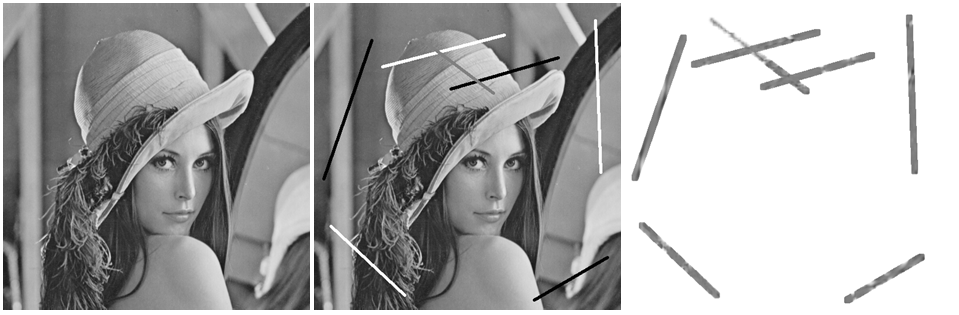 Figure 3: An experiment of quality assessment using the Q index (UIQI). On the left, we have the original Lena image. The central image is a processed version of the original image, where some black, white and gray lines were added. On the right, we have the UIQI quality map (produced by ImAnalysis), of the previous images. We can see that quality index maps depict both the intensity of the quality change as well as the spatial regions which have subdued alterations and therefore, quality degradation. Note: This figure is a preview. If you are interested in the original data, you can download them in the test data section.
The purpose of this program is to quantify the quality of digital imagery. In many cases, we want to compare two or more images. Given an original image (reference image) and one or more processed images, one can accurately measure their differences – quality, in relation to the reference image, without examining them visually. This image quality assessment is often accomplished using image quality indexes.
A significant advantage of quality indexes over manual visual evaluation, is that indices are more objective because they have standard criteria, contrary to humans. Another advantage of indexes, is that careful and meticulous image comparison is rather an arduous and time consuming task, especially when dealing with many images.
The current program calculates the following 8 quality indexes:
- Bias,
- CC (Correlation Coefficient),
- DIV (Difference In Variance),
- Entropy Difference,
- ERGAS (Erreur Relative Globale Addimensionelle de Synthese),
- UIQI (Universal Image Quality Index),
- RASE (Relative Average Spectral Error) and
- RMSE (Root Mean Squared Error)
Essentially, these indexes are mathematical formulas which are evaluated locally, in a neighborhood of pixels, using a sliding window of certain size (focal size parameter of the program). Due to this fact, we can obtain an “index quality map” if we want, which tells us locally how similar or dissimilar are the images in comparison.
However, usually we are interested in just one number, which indicates the overall quality of the image. This number is actually the average value of the index map we mentioned. Finally, these mean index values are written in a separate Microsoft Excel (*.xls) or CSV (*.csv) file.
1) Load your original (reference) image by clicking the ORIGINAL button.
2) Load your test(s) (processed) image(s) by clicking the TEST(s) button.
3) You can set the output folder, by clicking the ‘Set’ pushbutton.
However, you may find it useful that by default the program outputs to
the folder containing the original image.
4) Choose which indices you want the program to calculate. You can select
all indices at once, by pushing the ‘All’ button, under ‘Select:’ text.
5) You may want to change the FOCAL_SIZE parameter, which as mentioned,
specifies the size of the neighborhood or “window” (filter) in which each
index will be calculated. The larger the focal size, the more the
computations, the more the required time. Usually, we use a neighborhood
of 7 or 9. It is best to input an odd value in this parameter.
6) Optionally, you can check the export index maps button, if you want
the program to output the “index maps” for each index and test image. If
you work with georeferenced imagery, you will probably want to check the
export georeference button as well.
Note: The export georeference option works only with GeoTIFF images!
7) Press the ‘Analyze!’ button.
8) The program performs index analysis with your options. Messages should
appear in the command window, which state its current task. When all
calculations have finished, an Excel (or CSV, if Excel is not installed) file is
created with the results. If you opted to export the index maps, you can
find them in the newly created folder ‘Index maps’ (which will be in the
output folder).
1) You can use 2D (grayscale) or 3D (color with 3 or more bands) imagery.
2) Every TEST image must have the exact same resolution and dimensions with the ORIGINAL image.
3) The ED index is always calculated after conversion to 8-bits.
4) Multispectral and Hyperspectral Images are supported.
5) Try to use TIFF image format when possible, as this format is the most extensively tested.
6) Do not input indexed images for analysis (images with colormap). If you have indexed images that need processing, you have to convert them to RGB format first. Grayscale images can be indexed too, so be careful.
Here you can download the Original Grayscale “Lena” image (512×512) and the processed image used in figure 3.
Download Lena_tif_full_res_test_data.zip [TIFF format, Uncompressed, Non-indexed]
The Source Code of this program has been released. It can be found in the official file exchange site of Matlab:
http://www.mathworks.com/matlabcentral/fileexchange/41464-image-quality-index-analysis-gui
A. D. Vaiopoulos “Developing Matlab scripts for image analysis and quality assessment”, Proc. SPIE 8181, Earth Resources and Environmental Remote Sensing/GIS Applications II, 81810B (26 October 2011); https://doi.org/10.1117/12.897806
Credit goes to all the brilliant minds who proposed these Image Quality Indexes. I would like to thank Professor Zhou Wang, proposer of the UIQI (Q) index for providing both UIQI code and sample data. I would also like to thank Steve Hoelzer for the nifty progressbar and Roland Pfister for the .CSV functionality.